CFA-Level-2 Chartered Financial Analyst Level 2

Loading demo links...

Showing 10–12 of 20 questions

Question 10 (Quantitative Methods)

Austin Clark, CFA, has been asked to analyze White Goods Corporation, a $9 billion company that owns a nationwide chain of stores selling appliances and other electronic goods. As part of his analysis of the White Goods Corporation, Clark's supervisor, David Horvath, asks Clark to forecast White Goods' 2009 sales using multiple regression analysis. The following model was developed:

sales = 20.1 + 0.001 GDP+ 1,000.6 TR + 0.1 CC -3.2 PC -40.3 UR t-values: (1.1) (2.3) (1.75) (3.2) (-0.48) (-0.9)

Number of observations: 76

Standard error estimate: 15.67

Unadjusted R2: 0.96

Regression sum of squares: 412,522 Error sum of squares: 17,188

Independent Variable Descriptions

GDP = gross domestic product

TR = average coupon rate on 5-year U.S. Treasury securities

CC = most recent quarter end consumer confidence index value

PC = previous year's sales of personal computers UR = most recent quarter end unemployment rate

Variable Estimates for 2009

GDP =8,000

TR = 0.05

CC =97

PC = 60,000

UR = 0.055

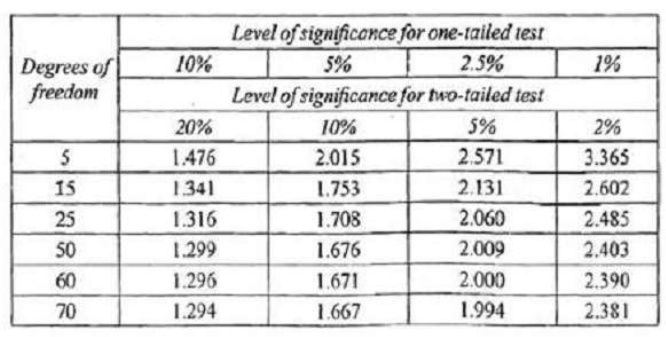
Critical Values For Student's t-Distribution

Clark's supervisor asks him to prepare a report explaining the implications of the regression analysis results. Clark writes the following conclusions concerning regression analysis in his report:

Interpreting the results of regression analysis can be problematic if certain assumptions of the ordinary least squares framework are violated. The regression output for White Goods Corporation is unreliable for the following reasons:

Finding 1: The correlation between regression errors across time is very close to 1.

Finding 2: There is a strong relationship between the regression error variance and the regression independent variables.

Is the regression coefficient of the 5-year U.S. Treasury interest rate statistically significantly different from zero at the 10% level of significance?

Select an option, then click Submit answer.

  • Yes, because 1.75 > 1.29.

  • Yes, because 1.75 > 1.67.

  • No, because 1.75 < 1.99.

Question 11 (Alternative Assets)

Russell Larson, CFA, is an investment analyst for Sentry Properties, Inc., a group of wealthy investors that is currently interested in purchasing Riviera Terrace, a 60- unit apartment complex in Southeastern Florida. The current owners of Riviera Terrace have agreed to sell the property for $40,000,000. Larson estimates that Rivjera Terrace's net operating income for the first year after the sale is finalized will be $4,200,000, and it is expected to maintain its historic annual growth rate of 5%.

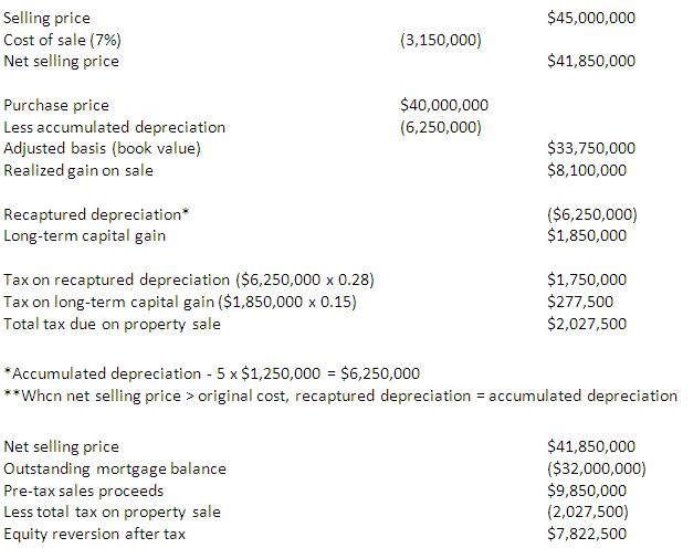
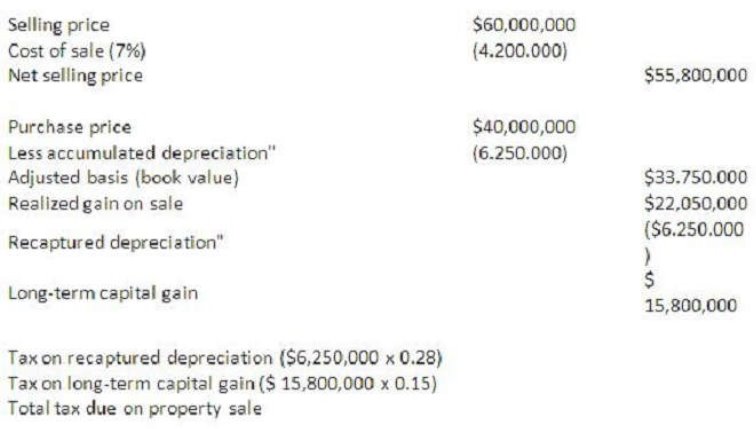
At Sentry's request, Larson will evaluate the investment in Riviera Terrace over a 5-year horizon using selling prices of $45,000,000 and S60,000,000.

During the due diligence process, Larson has determined that the average selling price for apartment complexes similar to Riviera Terrace is $1,250,000 per unit, with annual net operating income equal to $ 135,000 per unit. Larson has also determined that net operating income is typically 80% of gross income.

Larson has collected the following information to aid in his evaluation of Riviera Terrace.

• The property will be fully depreciated at a rate of S 1,250,000 per year over 32 years.

• Rental contracts are expected to be reissued on the date the sale is completed.

• Sentry has arranged to finance the investment with a 30-ycar, 7% interest-only loan, withmonthly payments and a face value equal to 80% of the initial investment.

• Selling expenses will be 7% of the gross selling price.

• The capital gains tax rate is 15%, the tax on recaptured depreciation is 28%, and the tax rate onordinary income is 40%.

• Sentry Properties' required return on equity is 20%.

• The interest rate on U.S. government bonds after adjustments for real estate based tax savings= 5.0%.

• The premium investors require for the illiquidity of real estate investments = 2.5%.

• The average real estate return net of appreciation = 1.25%.

• The real estate investment risk premium = 3.0%.

• The average internal rate of return for properties that are comparable to Riviera Terrace is 22%.

As part of the diligence process, Larson deems it to be appropriate to estimate the.market value of Riviera Terrace using capitalization rates based on the market extraction and built-up methods.

One of the partners in Sentry Properties has also asked Larson to estimate the market value of Riviera Terrace using: (1) the direct income capitalization approach and (2) the gross income multiplier approach.

There are several indicators that the Florida real estate market may take a downward turn over the next five years. With this in mind, Larson determines that there is a reasonable chance that Sentry will have to terminate its investment in Riviera Terrace at the end of year 3 at the initial purchase price of $40,000,000. Under this scenario, he estimates the equity reversion after tax (ERAT) in year 3 to be $4,934,000. Cash flow after tax in years 1 and 2 are $1,676,000 and $1,802,000, respectively.

In the scenario in which Sentry will sell Riviera Terrace for $45,000,000 at the end of the investment horizon, the equity reversion after tax is closest to:

Select an option, then click Submit answer.

  • $2,027,500.

  • $4,983,334.

  • $7,822,500.

Question 12 (Quantitative Methods)

William Shears, CFA, has been assigned the task of predicting sales for the specialty retail industry. Shears finds that sales have been increasing at a fairly constant rate over time and decides to estimate the linear trend in sales for the industry using quarterly data over the past 15 years, starting with Quarter 1 of 1994 and ending with Quarter 4 of 2008. On January 1, 2009, Shears estimates the following model:

Shears also estimates an autoregressive model of order one, AR(1), using the changes in quarterly sales data for the industry from the first quarter of 1994 through the fourth quarter of 2008. He obtains the following results for his AR(1) model:

Shears also derives a regression using the residuals from the AR(1) model. He regresses the squared residuals (or estimated errors) against the lagged squared residuals. The results of this regression are reported in Exhibit 4.

Quarterly sales for the Specially Retail Industry during 2008 were:

Shears's supervisor, Sam Kite, expresses concern that equation (1) might be misspecified. Specifically, Kite refers to the finding that "sales have been increasing at a fairly constant rate over time.

Assuming the AR(1) model in Exhibit 2 is appropriate, Shears should conclude that the change in sales is likely to:

Select an option, then click Submit answer.

  • fall from Quarter 4, 2008 levels.

  • rise from Quarter 4, 2008 levels.

  • remain unchanged from Quarter 4, 2008 levels.