CFA-Level-3 Chartered Financial Analyst Level 3

Loading demo links...

Showing 4–6 of 15 questions

Question 4 (Portfolio Management and Wealth Planning)

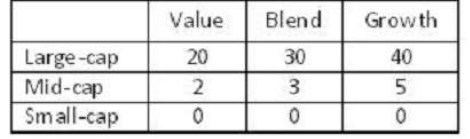
Kim Simpson, CFA, manages a $75 million multi-cap growth portfolio. Simpson utilizes a growth at a reasonable price (GARP) investment strategy and her investment universe consists of small, medium and large capitalization stocks. She turns the entire portfolio over once each year. Simpson is concerned about the amount of trading costs she has generated through the implementation of her investment strategy. Simpson decides to conduct a trade cost analysis with the cooperation of her trader, Janet Long, CFA. Simpson believes the results of the trading analysis can be used to improve trading performance and help to refine her investment strategy. The first trade they examine is a purchase of 2000 shares of Technology Company that was completed using a market order. Simpson remembers adding to her Technology Company position based on her analyst's recommendation that the company was going to generate earnings significantly above the consensus estimate in a soon to be released earnings report. The order was split into two trades as shown in Figure 1.

Figure 1: Technology Company buy order for 2000 shares

In conducting a comprehensive analysis of the trading markets, Simpson states that she is most concerned about market liquidity. Simpson defines a market with good liquidity as one with diversity of opinion, many buyers/sellers and relatively wide bid-ask spreads. In addition to reviewing market liquidity, Simpson believes that, in order to assess market quality, both the ease with which investors can obtain accurate information and the certainty that a trade will be completed must be evaluated.

Simpson and Long review their trade of Nano Corporation, a small biotechnology company. Simpson used a limit order because her analyst had established a specific buy target and she wanted to hold down transaction costs. To handle both explicit and implicit trading costs, Simpson measures execution costs using implementation shortfall. The buy order for 100,000 shares of Nano stock has the following timeline:

• Nano stock price closes at $35.00 per share.

• Day one: Simpson places a limit order for 100,000 shares of Nano stock at $34.75 per share orbetter at the opening of trading. However, Nano's stock never falls below $35.00 per share and closes at $36.50 per share.

• Day two: Simpson adjusts her limit order price to $37.00 per share or better. Long is able to fill50,000 shares of the order at $36.75 per share. Nano's stock climbs to $38.00 per share during the day and Simpson moves the limit price to $40.00 per share or better. Long completes the purchase of the remaining 50,000 shares of Nano at $40.00 per share, which is also the closing price of Nano's stock.

• The commission for each block trade is $2,500.

Long suggests implementing the Best Execution concept as established by the CFA Institute in its Trade Management Guidelines. Long states best execution would accept a high portfolio turnover strategy provided the overall portfolio value is greater after trading costs. Long asserts that her professional relationships are integral to best execution.

Which one of the following trader motivations best describe the Technology Company trade?

Select an option, then click Submit answer.

  • Information-motivated.

  • Value-motivated.

  • Liquidity-motivated.

Question 5 (Portfolio Management and Wealth Planning)

Sue Gano and Tony Cismesia are performance analysts for the Barth Group. Barth provides consulting and compliance verification for investment firms wishing to adhere to the Global Investment Performance Standards (GIPS ®). The firm also provides global performance evaluation and attribution services for portfolio managers. Barth recommends the use of GIPS to its clients due to its prominence as the standard for investment performance presentation. One of the Barth Group's clients, Nigel Investment Advisors, has a composite that specializes in exploiting the results of academic research. This Contrarian composite goes long "loser" stocks and short "winner" stocks. The "loser' stocks are those that have experienced severe price declines over the past three years, while the "winner" stocks are those that have had a tremendous surge in price over the past three years. The Contrarian composite has a mixed record of success and is rather small. It contains only four portfolios. Gano and Cismesia debate the requirements for the Contrarian composite under the Global Investment Performance Standards.

The Global Equity Growth composite of Nigel Investment Advisors invests in growth stocks internationally, and is tilted when appropriate to small cap stocks. One of Nigel's clients in the Global Equity Growth composite is Cypress University. The university has recently decided that it would like to implement ethical investing criteria in its endowment holdings. Specifically, Cypress does not want to hold the stocks from any countries that are deemed as human rights violators.

Cypress has notified Nigel of the change, but Nigel does not hold any stocks in these countries.

Gano is concerned that this restriction may limit investment manager freedom going forward. Gano and Cismesia are discussing the valuation and return calculation principles for both portfolios and composites, which they believe have changed over time. In order to standardize the manner in which investment firms calculate and present performance to clients, Gano states that GIPS require the following:

Statement 1: The valuation of portfolios must be based on market values and not book values or cost. Portfolio valuations must be quarterly for all periods prior to January 1, 2001. Monthly portfolio valuations and returns are required for periods between January 1, 2001 and January 1, 2010.

Statement 2: Composites are groups of portfolios that represent a specific investment strategy or objective. A definition of them must be made available upon request. Because composites are based on portfolio valuation, the monthly requirement for return calculation also applies to composites for periods between January 1, 2001 and January 1, 2010.

The manager of the Global Equity Growth composite has a benchmark that is fully hedged against currency risk. Because the manager is confident in his forecasting of currency values, the manager does not hedge to the extent that the benchmark does. In addition to the Global Equity Growth composite, Nigel Investment Advisors has a second investment manager that specializes in global equity. The funds under her management constitute the Emerging Markets Equity composite. The benchmark for the Emerging Markets Equity composite is not hedged against currency risk. The manager of the Emerging Markets Equity composite does not hedge due to the difficulty in finding currency hedges for thinly traded emerging market currencies. The manager focuses on security selection in these markets and does not try to time the country markets differently from the benchmark.

The manager of the Emerging Markets Equity composite would like to add frontier markets such as Bulgaria, Kenya, Oman, and Vietnam to their composite, with a 20% weight- The manager is attracted to frontier markets because, compared to emerging markets, frontier markets have much higher expected returns and lower correlations. Frontier markets, however, also have lower liquidity and higher risk. As a result, the manager proposes that the benchmark be changed from one reflecting only emerging markets to one that reflects both emerging and frontier markets. The date of the change and the reason for the change will be provided in the footnotes to the performance presentation. The manager reasons that by doing so, the potential investor can accurately assess the relative performance of the composite over time.

Cismesia would like to explore the performance of the Emerging Markets Equity composite over the past two years. To do so, he determines the excess return each period and then compounds the excess return over the two years to arrive at a total two-year excess return. For the attribution analysis, he calculates the security selection effect, the market allocation effect, and the currency allocation effect each year. He then adds all the yearly security selection effects together to arrive at the total security selection effect. He repeats this process for the market allocation effect and the currency allocation effect.

Which of the following best describes Cismesia's calculation of the two-year excess return and two-year attribution analysis for the Emerging Markets Equity composite?

Select an option, then click Submit answer.

  • The calculations for both the excess return and attribution analysis are correct.

  • The calculations for both the excess return and attribution analysis are incorrect.

  • The calculations for the excess return are correct but the calculations for the attribution analysis are incorrect.

Question 6 (Asset Classes)

Geneva Management (GenM) selects long-only and long-short portfolio managers to develop asset allocation recommendations for their institutional clients.

GenM Advisor Marcus Reinhart recently examined the holdings of one of GenM's long-only portfolios actively managed by Jamison Kiley. Reinhart compiled the holdings for two consecutive non-overlapping five year periods. The Morningstar Style Boxes for the two periods for Kiley's portfolio are provided in Exhibits 1 and 2.

Exhibit 1: Morningstar Style Box: Long-Only Manager for Five-Year Period 1

Exhibit 2: Morningstar Style Box: Long-Only Manager for Five-Year Period 2

Reinhart contends that the holdings-based analysis might be flawed because Kiley's portfolio holdings are known only at the end of each quarter. Portfolio holdings at the end of the reporting period might misrepresent the portfolio's average composition. To compliment his holdings-based analysis, Reinhart also conducts a returns-based style analysis on Kiley's portfolio. Reinhart selects four benchmarks:

1. SCV: a small-cap value index.

2. SCG: a small-cap growth index.

3. LCV: a large-cap value index.

4. LCG: a large-cap growth index.

Using the benchmarks, Reinhart obtains the following regression results:

Period 1: Rp = 0.02 + H0.01(SCV) + 0.02(SCG) + 0.36(LCV) + 0.61(LCG)

Period 2: Rp = 0.02 + 0.01(SCV) + 0.02(SCG) + 0.60(LCV) + 0.38(LCG)

Kiley's long-only portfolio is benchmarked against the S&P 500 Index. The Index's current sector allocations are shown in Exhibit 3.

Exhibit 3: S&P 500 Index Sector Allocations

GenM strives to select managers whose correlation between forecast alphas and realized alphas has been fairly high, and to allocate funds across managers in order to achieve alpha and beta separation. GenM gives Reinhart a mandate to pursue a core-satellite strategy with a small number of satellites each focusing on a relatively few number of securities.

In response to the core-satellite mandate, Reinhart explains that a Completeness Fund approach offers two advantages:

Advantage 1: The Completeness Fund approach is designed to capture the stock selecting ability of the active manager, while matching the overall portfolio's risk to its benchmark.

Advantage 2: The Completeness Fund approach allows the Fund to fully capture the value added from active managers by eliminating misfit risk.

Reinhart is concerned that the portfolio managed by Kiley has style drift. Is Reinhart's concern supported by either holdings-based style analysis or returns-based style analysis?

Select an option, then click Submit answer.

  • Only the holdings-based style analysis supports style drift.

  • Only the returns-based style analysis supports style drift.

  • Both approaches support style drift.