Historically, two different methods have been used to estimate the fluid pressure in capillary beds.
Method 1
A glass pipette is inserted into the capillary. The level of blood rising in the pipette is measured and used to calculate the pressure. Alternatively, an inert fluid of density ρ can be placed in the pipette and its height h can be measured. The pressure in the capillary is given by ρgh, where g is the acceleration due to gravity.
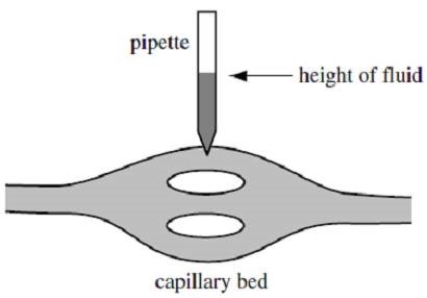
Figure 1
Method 2
The pressure can be measured indirectly in the following way. A section of gut tissue is removed from a specimen and placed on a beam balance. Blood is circulated through the tissue by a pump. The arterial pressure is then decreased. This leads to a decrease in the capillary hydrostatic pressure in the gut capillaries. The constant osmotic pressure of plasma proteins in the capillary causes absorption of fluid from the gut section which will decrease its weight. To prevent a change in the weight of the gut section, the venous pressure is increased. This tends to increase the capillary pressure, reducing the flow of fluid from the gut tissue into the capillaries. The capillary pressure is thus held constant (and the balance kept level) as the arterial pressure is decreased and the venous pressure increased. The arterial and venous pressures meet at the capillary pressure being measured.
(Π = MRT, where Π is the osmotic pressure, M the molarity of the solutes, R the universal gas constant, and T the temperature in Kelvin.)
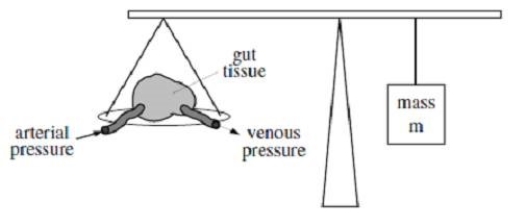
Figure 2
Assume that the beam balance of Method 2 is initially level. If the arterial pressure is decreased to a lower level while everything else is held constant, which graph best represents the change in the mass of the gut following the decrease in arterial pressure?
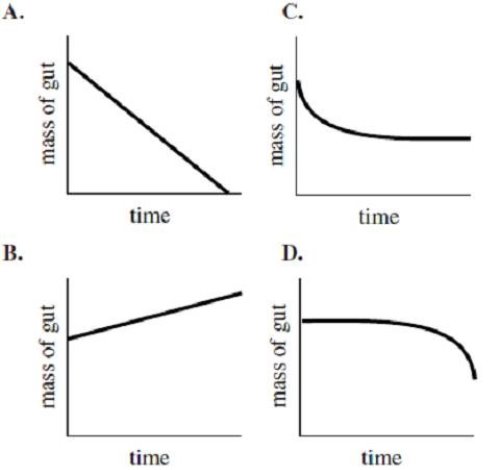
Select an option, then click Submit answer.
-
○
A
-
○
B
-
○
C
-
○
D