What do the vmstat si and so fields show?
Select an option, then click Submit answer.
- ○ Swap in and out
- ○ Sockets in and out
- ○ Services in and out
- ○ Sectors in and out
Loading demo links...
Showing 1–12 of 12 questions
What do the vmstat si and so fields show?
Select an option, then click Submit answer.
Which tool shows utilization for each CPU core?
Select an option, then click Submit answer.
What does sar collect over time?
Select an option, then click Submit answer.
What does powertop help identify?
Select an option, then click Submit answer.
What does Performance Co-Pilot provide?
Select an option, then click Submit answer.
Which command displays system hardware details from SMBIOS tables?
Select an option, then click Submit answer.
Which tools analyze and report system behavior? (Choose two.)
Select all that apply, then click Submit answer.
Which does PCP provide for performance analysis? (Choose two.)
Select all that apply, then click Submit answer.
DRAG DROP
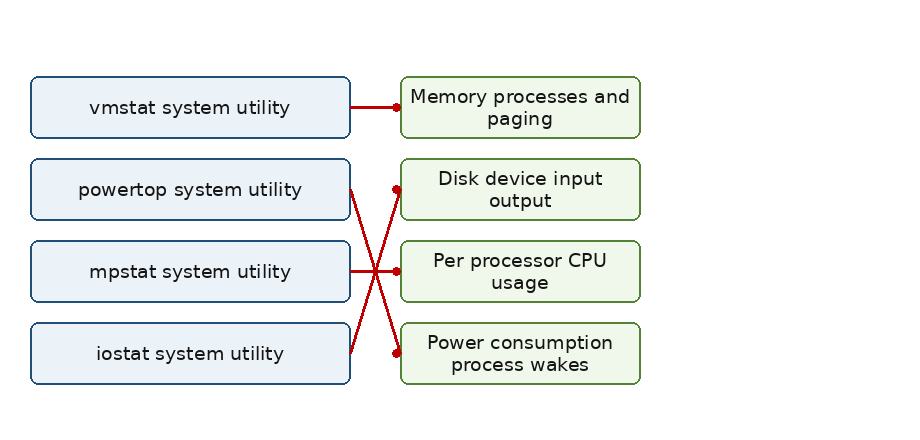
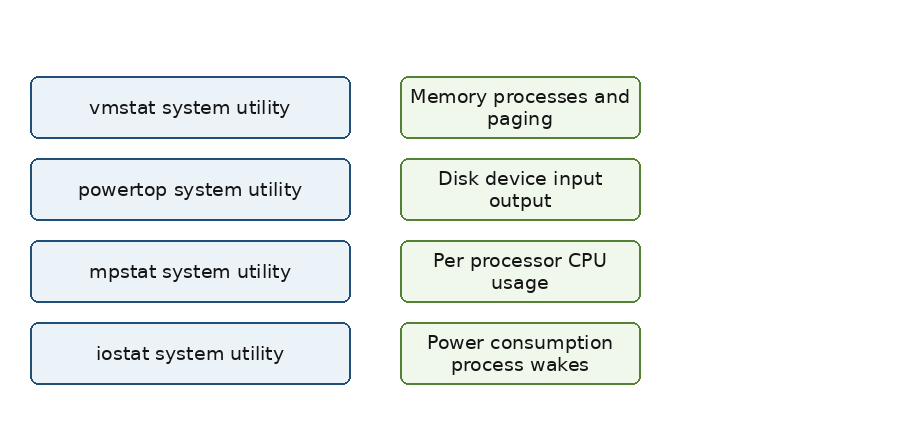
Match each analysis utility to what it reports.
Items to match: vmstat system utility, iostat system utility, mpstat system utility, powertop system utility.

Answer is in the explanation below.
CORRECT TEXT
The ______ tool reports CPU usage broken down by processor core.
Answer is in the explanation below.
Which ways can kernel runtime parameters be changed? (Choose two.)
Select all that apply, then click Submit answer.
DRAG DROP
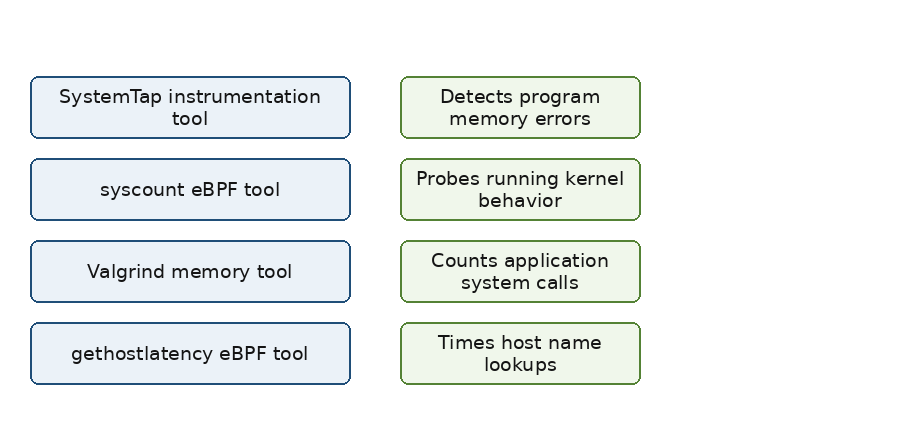
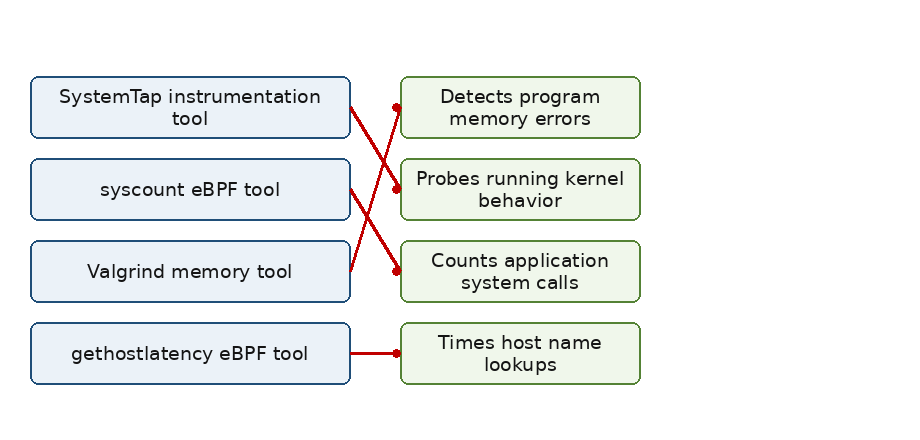
Match each analysis tool to its diagnostic use.
Items to match: Valgrind memory tool, SystemTap instrumentation tool, syscount eBPF tool, gethostlatency eBPF tool.

Answer is in the explanation below.