TDS-C01 Tableau Desktop Specialist

Loading demo links...

Showing 13–15 of 15 questions

Question 13

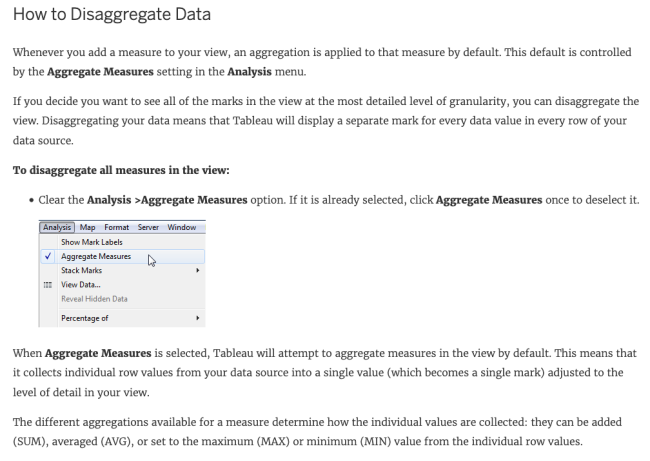
If you decide you want to see all of the marks in the view at the most detailed level of granularity, you can __________________ the view.

Select an option, then click Submit answer.

  • sort the measures

  • disaggregate the measures

  • break-down the measures

  • aggregate the measures

  • split the measures

Question 14

Using the Geo Data table, create a Bar chart showing the In-Stock percentage for each Color. What is the Average In-Stock percentage for the Color Red? Present your answer correctly upto 2 decimal places.

Select an option, then click Submit answer.

  • 96.46%

  • 95.12%

  • 97.12%

  • 99.46%

Question 15

What is the following icon in the Data pane used to do?

Larger image

Select an option, then click Submit answer.

  • View Data

  • Clean Data

  • Extract Data

  • Sort Data