ICGB IASSC Certified Lean Six Sigma Green Belt

Loading demo links...

Showing 4–6 of 10 questions

Question 4

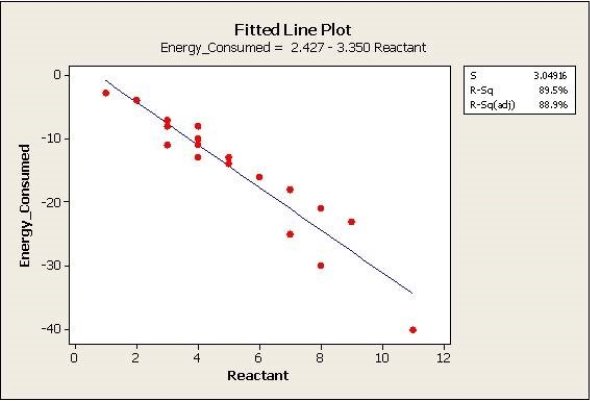
Which statement(s) are true about the Fitted Line Plot shown here? (Note: There are 2 correct answers).

Select all that apply, then click Submit answer.

  • When Reactant increases, the Energy Consumed increases.

  • The slope of the equation is a positive 130.5.

  • The predicted output Y is close to -18 when the Reactant level is set to 6.

  • Over 85 % of the variation of the Energy Consumed is explained by the Reactant via this Linear Regression.

Question 5

Significant variation in process performance is a consequence of several causes that can be classified using which of the terminologies shown. (Note: There are 2 correct answers).

Select all that apply, then click Submit answer.

  • Common

  • Random

  • Uneducated

  • Special

  • Vital

Question 6

Long-term Data represents all the variation that one can expect within the subject process.

Select an option, then click Submit answer.

  • True

  • False