DA-100 Analyzing Data with Microsoft Power BI

Loading demo links...

Showing 4–6 of 10 questions

Question 4 (Mixed Questions)

You have the tables shown in the following table.

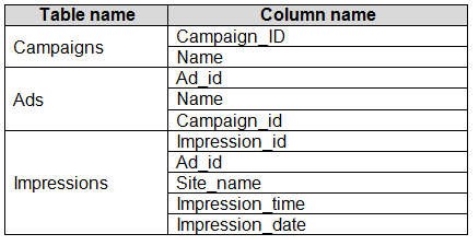
The Impressions table contains approximately 30 million records per month.

You need to create an ad analytics system to meet the following requirements:

Present ad impression counts for the day, campaign, and Site_name. The analytics for the last year are required. Minimize the data model size.

Which two actions should you perform? Each correct answer presents part of the solution.

NOTE: Each correct selection is worth one point.

Select all that apply, then click Submit answer.

  • Group the impressions by Ad_id, Site_name, and Impression_date. Aggregate by using the CountRows function.

  • Create one-to-many relationships between the tables.

  • Create a calculated measure that aggregates by using the COUNTROWS function.

  • Create a calculated table that contains Ad_id, Site_name, and Impression_date.

Question 5 (Mixed Questions)

You have several Power BI visualizations that you want to embed in a public website.

Which two visualizations can you embed into the website?

NOTE: Each correct selection is worth one point.

Select all that apply, then click Submit answer.

  • Visualizations that use row-level security (RLS)

  • Visualizations that use datasets stored in Microsoft OneDrive for Business

  • Custom visualizations

  • Visualizations that contain reports shared to your user account

  • Q&A for Power BI visuals

  • Visualizations that use report-level DAX measures.

Question 6 (Mixed Questions)

You have a prospective customer list that contains 1,500 rows of data. The list contains the following fields:

First name

Last name

Email address

State/Region

Phone number

You import the list into Power Query Editor.

You need to ensure that the list contains records for each State/Region to which you want to target a marketing campaign.

Which two actions should you perform? Each correct answer presents part of the solution.

NOTE: Each correct selection is worth one point.

Select all that apply, then click Submit answer.

  • Open the Advanced Editor.

  • Select Column quality.

  • Enable Column profiling based on entire dataset.

  • Select Column distribution.

  • Select Column profile.