Note: This question is part of a series of questions that use the same scenario. For your convenience, the scenario is repeated in each question. Each question presents a different goal and answer choices, but the text of the scenario is the same in each question in this series.
Start of repeated scenario.
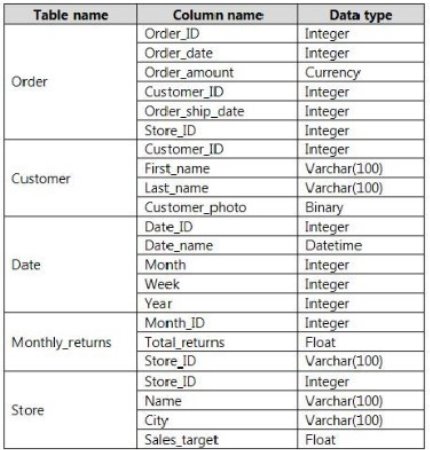
You have a Microsoft SQL Server database that contains the following tables.
The following columns contain date information:
![]() Date[Month] in the mmyyyy format
Date[Month] in the mmyyyy format
![]() Date[Date_ID] in the ddmmyyyy format
Date[Date_ID] in the ddmmyyyy format
![]() Date[Date_name] in the mm/dd/yyyy format
Date[Date_name] in the mm/dd/yyyy format ![]() Monthly_returns[Month_ID] in the mmyyyy format
Monthly_returns[Month_ID] in the mmyyyy format
The Order table contains more than one million rows.
The Store table has a relationship to the Monthly_returns table on the Store_ID column. This is the only relationship between the tables.
You plan to use Power BI Desktop to create an analytics solution for the data.
End of repeated scenario.
You plan to create a chart that displays total Order[Order_amount] by Store[Name].
You need to modify the model to ensure that you can create the chart.
Which two actions should you perform? Each correct answer presents part of the solution.
NOTE: Each correct selection is worth one point.
Select all that apply, then click Submit answer.
-
○
Create a relationship between the Order table and the Store table.
-
○
To the Order table, add a measure that uses the COUNTA('Order'[Order_ID]) DAX formula.
-
○
To the Order table, add a column that uses the RELATED('Store'[Store_ID]) DAX formula.
-
○
To the Order table, add a measure that uses the COUNT('Order'[Order_amount]) DAX formula.
