BA1 Fundamentals of Business Economics

Loading demo links...

Showing 1–3 of 20 questions

Question 1

The government has set a maximum house price due to a massive house price rise in the last decade. This is denoted by the line Q1Q2 on the graph.

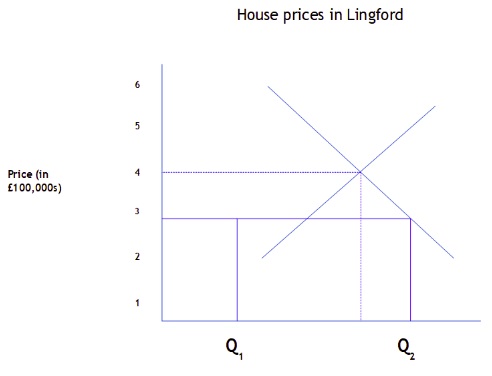
Which of the following may occur in light of the introduction of the maximum house price as it appears on the graph?

Select ALL that apply.

Select all that apply, then click Submit answer.

  • There will be a shortage of housing supply in Lingford.

  • A 'black market' may develop in housing, meaning the maximum price is ignored.

  • There will be a surplus of housing supply in Lingford.

  • Landowners will continue to build residential properties at the same rate as before the maximum price was implemented.

  • It is not likely that the maximum house price will need some sort of reform in the near future.

Question 2

The management of Pennyfarthing's Toy Bazaar requires financial advice, but is unsure of which type of bank to approach to acquire this. The company receives a profit of £1,000,000 a year, and currently operates in

Europe and North America.

Which of the following reasons explains why Pennyfarthings Toy Bazaar should use a wholesale bank?

Select all that apply, then click Submit answer.

  • It has a profit of £100,000

  • It has international operations

  • It uses the Alternative Investment Market

  • It has issued new shares to members of the public

  • It is a medium-sized business


Question 3

Brilliant Buys Local is a subsidiary of Brilliant Buys, and operates a number of smaller stores in local neighbourhoods.

The managing director of Brilliant Buys Local, Mr Davidson, has been given a scatter diagram with sales of each store based on the size of the local population.

Which of the following options outlines the best ways to interpret this diagram in this context? Select ALL that apply.

Select all that apply, then click Submit answer.

  • Use Pearson's coefficient to accurately draw a line of best fit

  • Draw a line of best fit by eye and estimate how much of a correlation there is between store sales and population

  • Rearrange the data points on the scatter diagram so that it shows any correlation more clearly

  • Use the diagram to interpret that two of the stores with the highest sales are in areas with a medium-sized population

  • Use the diagram to interpret that the store with the lowest sales was in an area with a population of 5000