LSSBB Lean Six Sigma Black Belt

Loading demo links...

Showing 1–3 of 15 questions

Question 1

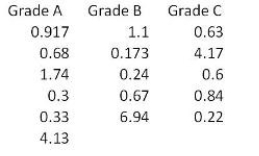
For the data shown here which statement(s) are true? (Note: There are 2 correct answers).

Select all that apply, then click Submit answer.

  • With 95% confidence, we cannot conclude if the samples are from three Normal Distributions.

  • With greater than 95% confidence, we conclude the samples are from Non-normal Distributions.

  • If we wanted to compare the Central Tendencies of these three samples we would use the one way ANOVA test.

  • If we wanted to compare the Central Tendencies of these three samples we could use Mood’s Median test.

Question 2

SPC Charts are used extensively in different business and decision-making environments. In this example a vendor is being selected based on speed of delivery. Which of the conclusions would help you pick a vendor for your needs regarding lead-time of delivery from your vendors? (Note: There are 4 correct answers).

Select all that apply, then click Submit answer.

  • Vendor A with a much shorter lead time in delivery

  • Vendor B as it has a better consistency (lower variance) on lead time

  • Vendor B as Vendor A shows a situation out of control as shown in red

  • Vendor B as the Control Limits are much narrower than Vendor A

  • Vendor B with higher lead time, but a process with much narrower Control Limits

Question 3

Which statement(s) are correct about the Pareto Chart shown here for the DOE analysis? (Note: There are 2 correct answers).

Select all that apply, then click Submit answer.

  • It is unknown from this graph how many factors were in the Experimental Design

  • The factors to keep in the mathematical model are E, D, DE, BD and B with an alpha risk equal to 2.06

  • The effects to keep in the mathematical model are E, D, DE, BD and B with an alpha risk equal to 0.05

  • The factors to keep in the mathematical model with a 5% alpha risk are BE, AB, A and AD