ICBB IASSC Certified Lean Six Sigma Black Belt

Loading demo links...

Showing 1–3 of 15 questions

Question 1

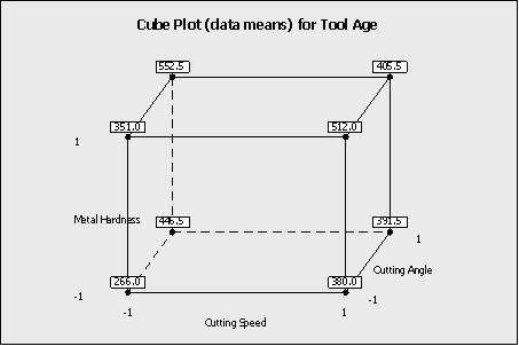
Which statement(s) are correct about the Factorial Plot shown here? (Choose three.)

Select all that apply, then click Submit answer.

  • When the cutting speed increased from low to high level, the tool age increases

  • The coefficient of the metal hardness is positively related to the output of tool age

  • The coded coefficient is lower for cutting speed than the cutting angle related to the output of tool age

  • These plots prove a statistically significance factor with 95% confidence

  • These plots are an example of interaction plots

Question 2

Which statement(s) are incorrect for the Regression Analysis shown here? (Choose two.)

Select all that apply, then click Submit answer.

  • The air-fuel ratio explains most of the TurbineOutput variation

  • The Regression explains over 98% of the process variation

  • This Multiple Linear Regression has three statistically significant independent variables

  • If the air-fuel ratio increases by 1, the TurbineOutput more than triples

  • The SteamExitTemp explains the most variation of the TurbineOutput

Question 3

Which statements are correct about the advanced Capability Analysis shown here? (Choose three.)

Select all that apply, then click Submit answer.

  • This is a Poisson Capability Analysis.

  • The average DPU with 95% confidence is between 0.024 and 0.0295.

  • The DPU does not seem to vary depending on sample size.

  • The process shows only one instance of being out of control statistically so we have confidence in the estimated DPU of this process.

  • The maximum DPU in one observation was nearly 0.0753.