Question 4
Which statement(s) are correct about the Regression shown here? (Note: There are 2 correct answers).
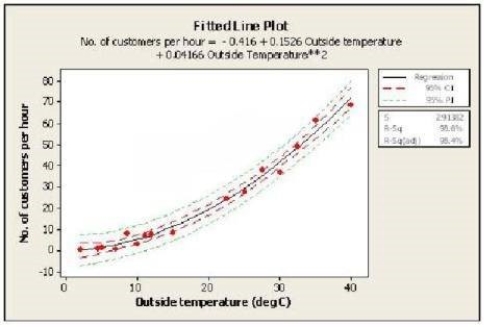
Select all that apply, then click Submit answer.
-
○
The dependent variable is the outside temperature
-
○
The relationship between outside temperature and number of customers per hour is a Linear Regression
-
○
The dashed lines indicate with 95% confidence where all of the process data should fall between
-
○
The dashed lines indicate with 95% confidence the estimate for the Quadratic Regression Line
-
○
The predicted number of customers per hour is close to 5 if the outside temperature is 10 deg C