Suppose you have been given two Random Variables X and Y, whose joint distribution is already known, the marginal distribution of X is simply the probability distribution of X averaging over information about Y. It is the probability distribution of X when the value of Y is not known. So how do you calculate the marginal distribution of X
Select all that apply, then click Submit answer.
Reference / correct answer:
This is typically calculated by summing the joint probability distribution over Y.
This is typically calculated by integrating the joint probability distribution over Y
This is typically calculated by summing (In case of discrete variable) the joint probability distribution over Y
This is typically calculated by integrating(ln case of continuous variable) the joint probability distribution over Y.
: Given two random variables X and Y whose joint distribution is known, the marginal distribution of X is simply the probability distribution of X averaging over information about Y. It is the probability distribution of X when the value of Y is not known.
This is typically calculated by summing or integrating the joint probability distribution over
Y. '
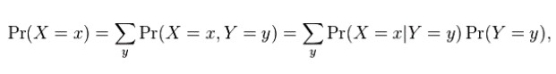
For discrete random variables, the marginal probability mass function can be written as Pr(X = x). This is
Text
Description automatically generated with low confidence where Pr(X = x,Y = y) is the joint distribution of X and Y, while Pr(X = x|Y = y) is the conditional distribution of X given Y In this case, the variable Y has been marginalized out. Bivariate marginal and joint probabilities for discrete random variables are often displayed as two-way tables.
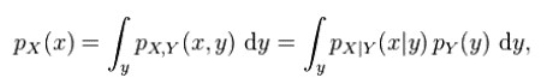
Similarly for continuous random variables, the marginal probability density function can be written as pX(x). This is
Diagram
Description automatically generated with medium confidence
where pX.Y(x.y) gives the joint distribution of X and Y while pX|Y(x|y) gives the conditional distribution for X given Y Again: the variable Y has been marginalized out.
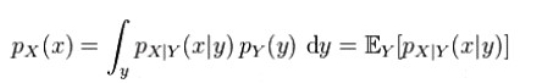
Note that a marginal probability can always be written as an expected value:
Text, letter
Description automatically generated
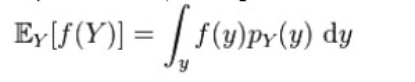
Intuitively, the marginal probability of X is computed by examining the conditional probability of X given a particular value of Y, and then averaging this conditional probability over the distribution of all values of Y This follows from the definition of expected value, i.e.
in general
A picture containing diagram
Description automatically generated
